Portfolio Details
Ui Operations > Grafana TIG Stack Integration and Deployment
Grafana TIG Stack Integration and Deployment
Price: 1100$
Duration: 1 Week
01
Client Requirement
The client approached us with the need for an advanced monitoring solution to track the performance of their infrastructure, applications, and services. They wanted an easy-to-use, centralized dashboard to visualize real-time metrics, logs, and events. The primary requirements included:
- Real-Time Metrics Monitoring:
The client needed a real-timemonitoring solution to visualize critical metrics from their infrastructure, including server performance (CPU, memory, disk usage), network activity, application health, and more. - Scalability:
They required a monitoring solution capable of scaling as the infrastructure grows, supporting cloud-based environments, containerized workloads, and on-premises servers. - Centralized Visualization:
The client desired a centralizeddashboard to display visualizations from different data sources, including infrastructure health, application performance, and business KPIs. - Alerting and Notifications:
The client needed alerting capabilities to trigger notifications based on performance thresholds, such as CPU usage spikes, memory consumption, and service downtime. - Integration with Existing Systems:
The solution needed to integrate seamlessly with their existing monitoring, logging, and cloud infrastructure to aggregate data from multiple sources.
- Real-Time Metrics Monitoring:
02
Solution Delivered
To meet the client’s monitoring and visualization requirements, we implemented the TIG Stack (Telegraf, InfluxDB, and Grafana). This stack provides powerful real-time metrics collection, storage, and visualization, combined with robust alerting features. Here’s a breakdown of the solution:
- Telegraf Installation and Configuration:
Telegraf, the agent responsible for collecting and sending metrics to InfluxDB, was deployed on the client’s infrastructure:
- Telegraf Agent Setup: Installed on servers (Linux and Windows) to collect metrics such as CPU usage, memory consumption, disk I/O, network statistics, system uptime, custom application metrics, and cloud-based service metrics.
- Plugin Configuration: Telegraf’s wide range of input plugins was configured to collect data from various sources, such as:
- System Metrics: CPU, Memory, Disk, Network, and more.
- Application Metrics: Using Telegraf’s application-specific plugins (e.g., for Nginx, MySQL, MongoDB).
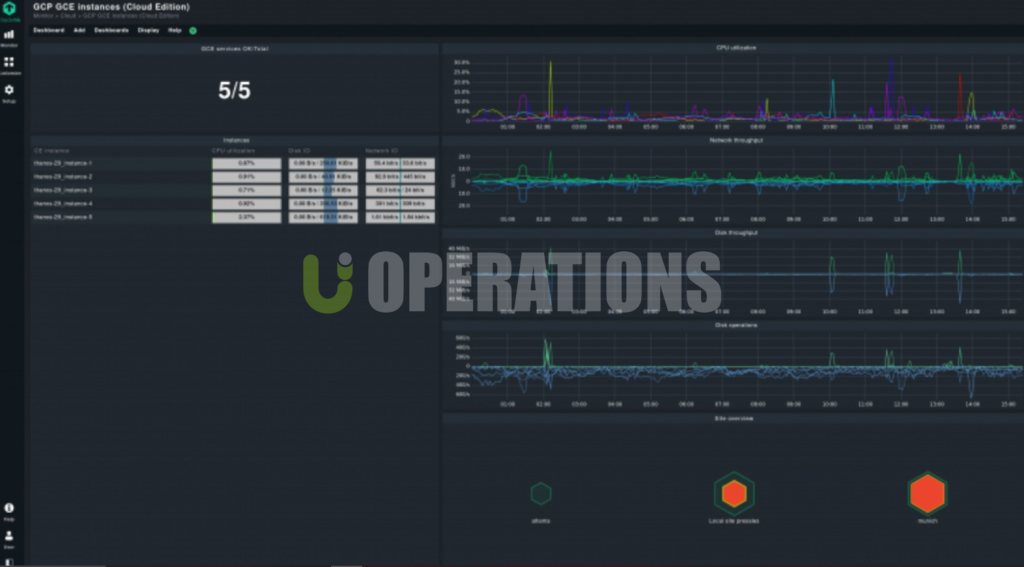
- Cloud Metrics: Integrating with cloud APIs (e.g., AWS, Azure) to fetch data about cloud instances, storage, and network performance.
- Container Metrics: Configured to collect metrics from Docker containers and Kubernetes clusters.
- InfluxDB Setup for Time-Series Data Storage:
InfluxDBwas used as the time-series database for storing the collected metrics:
- Database Configuration: Created a dedicated database schema in InfluxDB to store the incoming time-series data from Telegraf.
- Data Retention Policies: Set retention policies to define how long metrics data would be kept in InfluxDB to ensure optimal storage management.
- Performance Optimization: Optimized the InfluxDB instance for high throughput, ensuring efficient storage and querying of large datasets from multiple sources.
- Grafana Dashboard Creation:
Grafanawas deployed to provide real-time visualization of the metrics stored in InfluxDB:
- Grafana Dashboard Creation:
- Grafana Setup: Installed and configured Grafana to connect with InfluxDB as the data source.
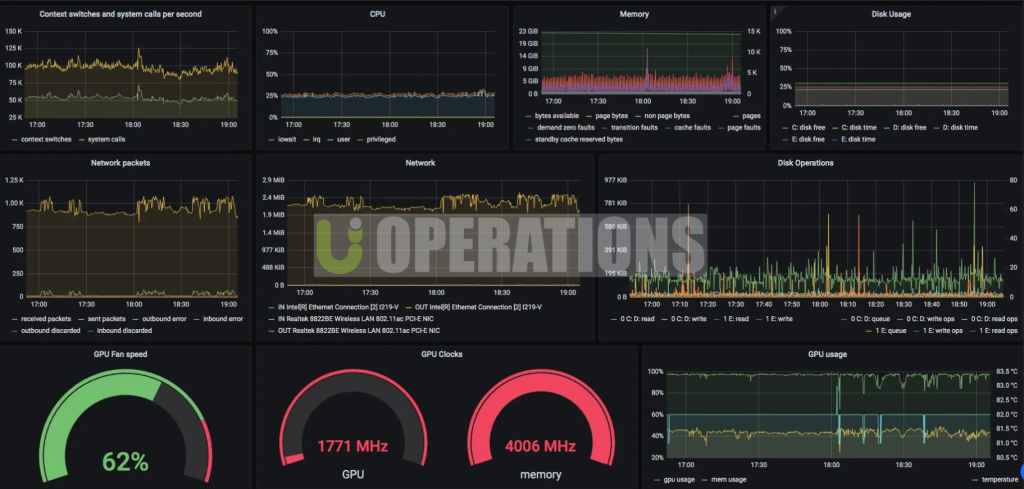
- Dashboards Design: Custom dashboards were designed to provide real-time, actionable insights. The client’s requirements for system health, application performance, and business KPIs were translated into easy-to-read, interactive dashboards.
- System Health Dashboards: Visualizations for metrics like CPU utilization, memory usage, disk performance, and network traffic.
- Application Performance Dashboards: Monitored metrics for key applications such as databases (MySQL, MongoDB), web servers (Nginx, Apache), and containerized applications.
- Custom KPI Dashboards: Designed dashboards that visualized business-specific KPIs, allowing the client to monitor the performance of critical business processes.
- Interactive Filters: Added filters to allow the client to dynamically adjust the time range, server selection, and metric types shown on the dashboards.
- Alerting and Notification Setup:
To ensure proactive monitoring, we configured alerting in Grafana:
- Alerting and Notification Setup:
- Threshold Alerts: Set up alerts for key metrics like high CPU usage, disk space usage, and memory consumption. Alerts were triggered when thresholds were exceeded.
- Notification Channels: Integrated email, Slack, and PagerDuty to receive instant alerts. This ensured that the relevant teams could respond to incidents as they arose.
- Alert Annotations: Configured Grafana to annotate dashboards with alerting events, providing context to the displayed metrics and helping users correlate issues with system changes or incidents.
- Integration with Existing Tools:
The TIG Stack was integrated into the client’s existing monitoring ecosystem:
- Integration with Existing Tools:
- Prometheus Integration: Integrated Prometheus to collect and store metrics related to Kubernetes Grafana was used to visualize both Prometheus and InfluxDB metrics on the same dashboards.
- Log Data Integration: Integrated GrafanaLoki (if applicable) for log aggregation, allowing logs and metrics to be visualized in the same Grafana dashboard.
- API Integration: Built custom APIconnections to pull in metrics and data from other third-party tools like Zabbix and Nagios, ensuring that the client’s existing infrastructure monitoring was part of the unified system.
- Scaling for High Availability and Redundancy:
The solution was designed for high availability:
- Scaling for High Availability and Redundancy:
- Kubernetes Deployment: Deployed the TIG Stack components within Kubernetes for easy scaling and management.
- Data Replication: Configured InfluxDB to replicate data across multiple nodes, ensuring no data loss in case of failure.
- Load Balancing: Set up load balancing for the Grafana and InfluxDB instances to distribute traffic and improve performance.
- Telegraf Installation and Configuration:
03
Key Achievements
- Real-Time Metrics Visualization:
The client gained a unified real-time visualization of key metrics across their infrastructure, applications, and business operations through customized Grafana dashboards. - Proactive Monitoring and Alerts:
With alertingset up in Grafana, the client was able to proactively monitor their infrastructure, addressing performance issues before they impacted users. - Scalable Architecture:
The solution was designed to scale with the client’s growing infrastructure, including cloud services and containerized environments, ensuring future-proof monitoring and visibility. - Centralized Data Monitoring:
By integrating Telegraf, InfluxDB, and Grafana, the client now had a centralized monitoring solution capable of pulling metrics from diverse sources and displaying them in one location. - Integration with Existing Systems:
The integration with other monitoring tools like Prometheus and Nagios allowed the client to consolidate their monitoring efforts, reducing duplication and ensuring all systems were covered.
04
Challenges Overcome
- Integration of Multiple Data Sources:
Combining multiple data sources, including cloud infrastructure, on-premises systems, and containerized applications, required a structured approach to data collection and storage. We implemented Telegraf’s plugins and custom integrations to consolidate these data sources into a unified dashboard. - Scalability for High-Volume Data:
Managing large volumes of time-series data in InfluxDB required careful planning and optimization. We implemented retention policies and data aggregation techniques to maintain performance while handling a high volume of incoming metrics. - Complex Alerting Logic:
Setting up detailed alerting for a wide range of metrics required fine-tuning threshold values and ensuring accurate alerts were triggered. We worked closely with the client to define the correct thresholds for different systems and services.
05
Technologies & Tools Used
- Grafana: Real-time dashboard and visualization tool for monitoring metrics.
- InfluxDB: Time-series database for storing metrics data.
- Telegraf: Metrics collection agent for gathering data from various sources.
- Prometheus: Integrated with Grafana for Kubernetes monitoring.
- Docker: Containerization of Grafana, Telegraf, and InfluxDB.
- Kubernetes: Orchestration and scaling for the TIG Stack.
- Slack/PagerDuty/Email: Notification channels for alerting.
06
Outcomes
The Grafana TIG Stack solution provided the client with a powerful, real-time monitoring and alerting system that is easy to scale and integrate with existing systems. It allowed the client to gain critical insights into infrastructure performance, application health, and business KPIs, ultimately improving operational efficiency and response time to incidents.
07
Conclusion
The Grafana, InfluxDB, and Telegraf (TIG Stack) integration enabled the client to achieve a scalable, real-time monitoring solution with visualization and alerting. This provided the client with deeper insights into their infrastructure, reduced downtime, and empowered their teams to proactively manage system performance.